The R Revolution
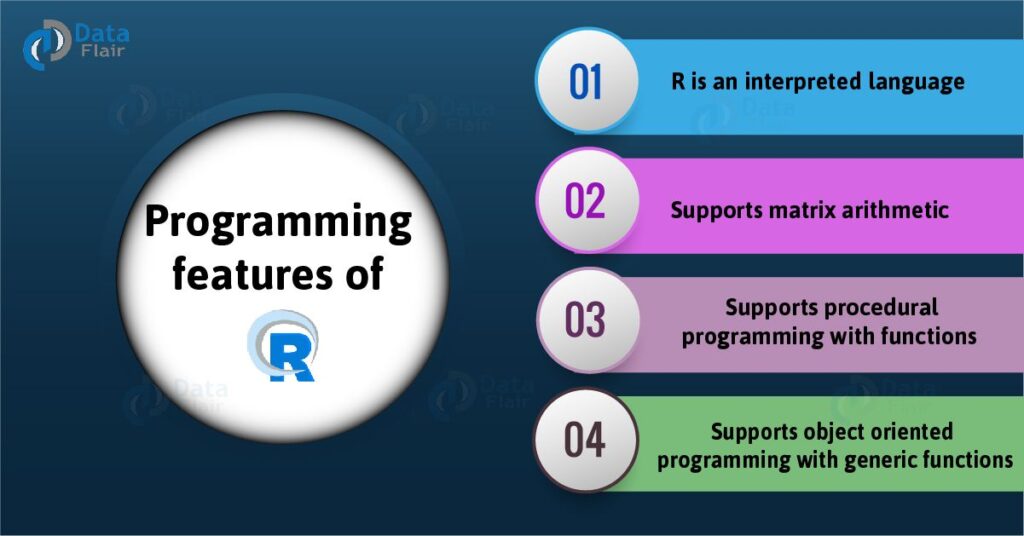
In this era of data-driven decision-making, the R programming language has carved its niche as a powerful tool for data analysis and statistical computing. Its journey from a humble beginning to becoming a cornerstone of modern data science is nothing short of revolutionary. R’s open-source nature has fostered a collaborative global community of data enthusiasts, statisticians, and analysts.
R’s strength lies in its extensive ecosystem of packages, each tailored to address specific data analysis challenges. It’s not just a language; it’s a thriving ecosystem. This blog post explores how R’s collaborative nature and expansive package repository contribute to its widespread adoption in data analysis and statistical computing. We’ll also touch on some iconic packages that have revolutionized the field.
Data Manipulation and Transformation
Data manipulation is the first step in the data analysis journey, and R offers a treasure trove of tools to make this process efficient and effective. In this chapter, we’ll dive deep into R’s capabilities for data manipulation and transformation.
R’s data frames, akin to tables, provide a structured way to organize data. We’ll explore how data frames simplify the storage and manipulation of data. Furthermore, we’ll discuss the principles of tidy data and how R’s tidyr package streamlines data tidying by reshaping, separating variables, and gathering columns into rows.
But data manipulation isn’t just about tidying data; it’s about filtering, cleaning, and transforming it to suit our analysis needs. R’s dplyr package offers intuitive functions for these tasks. We’ll delve into filtering, selecting, arranging, and summarizing data using dplyr functions.
Additionally, we’ll cover data cleaning, variable creation, and aggregation.
Joining datasets is another critical aspect of data manipulation. R provides various functions for merging data frames, and we’ll explore how to combine data from different sources seamlessly.
This chapter will equip you with the skills to efficiently prepare your data for analysis, ensuring that your subsequent statistical and machine learning endeavors are built on a solid foundation of clean, well-structured data.
want to learn how to better utilize R language? check out this course
Statistical Analysis Made Simple
R’s roots in statistics run deep, and it continues to excel in this domain. In this chapter, we’ll delve into R’s extensive capabilities for statistical analysis.
From hypothesis testing and regression analysis to survival analysis and Bayesian modeling, R offers a comprehensive suite of statistical functions and packages. We’ll explore some of these functions and discuss how they enable data professionals to derive meaningful insights from data.
We’ll also touch on the importance of statistical rigor in data analysis and how R supports it through a wide range of statistical tests, simulations, and graphical tools. Whether you’re a statistician or a data analyst, this chapter will showcase R’s prowess in statistical analysis.
Stay tuned for more chapters as we continue to explore the multifaceted world of R and its applications in data science and statistical computing.
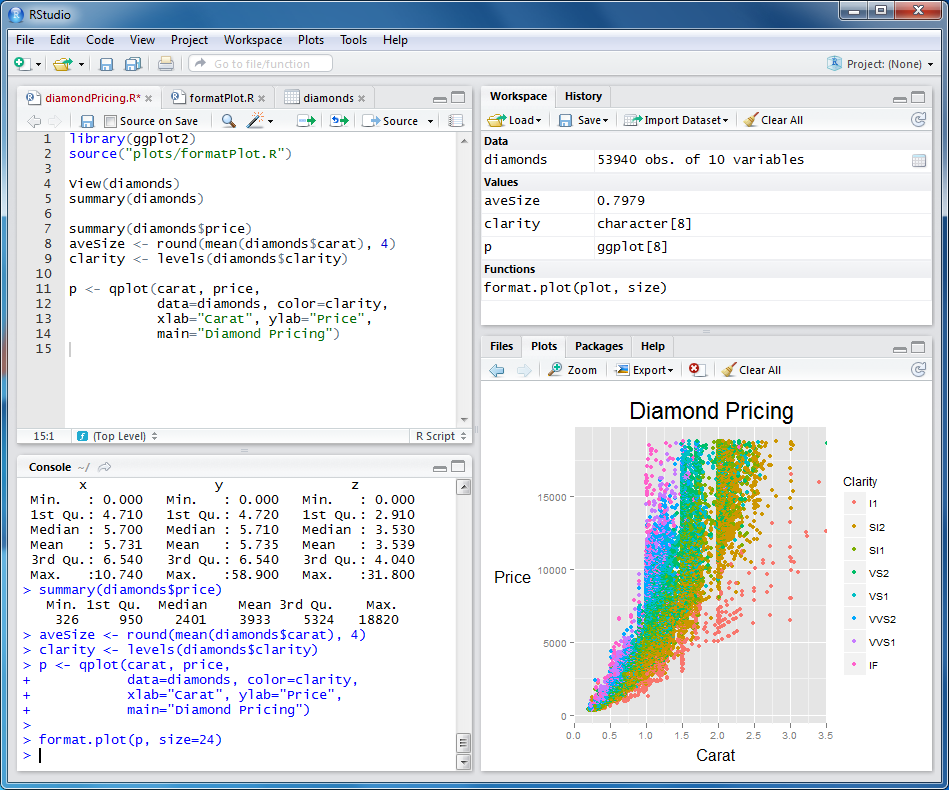
Data Visualization with ggplot2
Data visualization is a key aspect of data analysis. We’ll discuss R’s ggplot2 package, which allows professionals to create stunning and informative data visualizations. Readers will understand how to craft compelling charts and graphs that convey complex insights.
Machine Learning with R
Machine learning is at the forefront of data analysis. We’ll explore how R’s machine learning libraries, like caret and xgboost, enable professionals to build predictive models and uncover hidden patterns within data.
R in Real-World Applications
In this section, we’ll showcase how R is used in various industries, from finance and healthcare to marketing and academia. Readers will gain insights into real-world applications and understand how R is driving innovation and decision-making.
R’s Contribution to Open Science
R plays a pivotal role in open science and reproducible research. We’ll discuss RMarkdown and Shiny, tools that make it easy to share and collaborate on data analysis projects. Readers will see how R supports transparency and knowledge sharing.
The Future of R
In the closing chapter, we’ll explore the future of R and its evolving role in data analysis and statistical computing. We’ll touch on trends such as R’s integration with big data technologies and its continuous development to meet the evolving needs of data professionals.
Conclusion
R is not just a programming language; it’s a gateway to unlocking the insights hidden within data. Whether you’re a data scientist, analyst, researcher, or anyone working with data, R empowers you to explore, analyze, and visualize information in ways that drive innovation and informed decision-making. With its vibrant community and ever-evolving capabilities, R is poised to remain a pillar of the data science landscape for years to come.